Profit and Loss Report
Overview
To view your Profit & Loss Report, go to the Main Reporting section. The Profit & Loss will be the first page displayed by default.
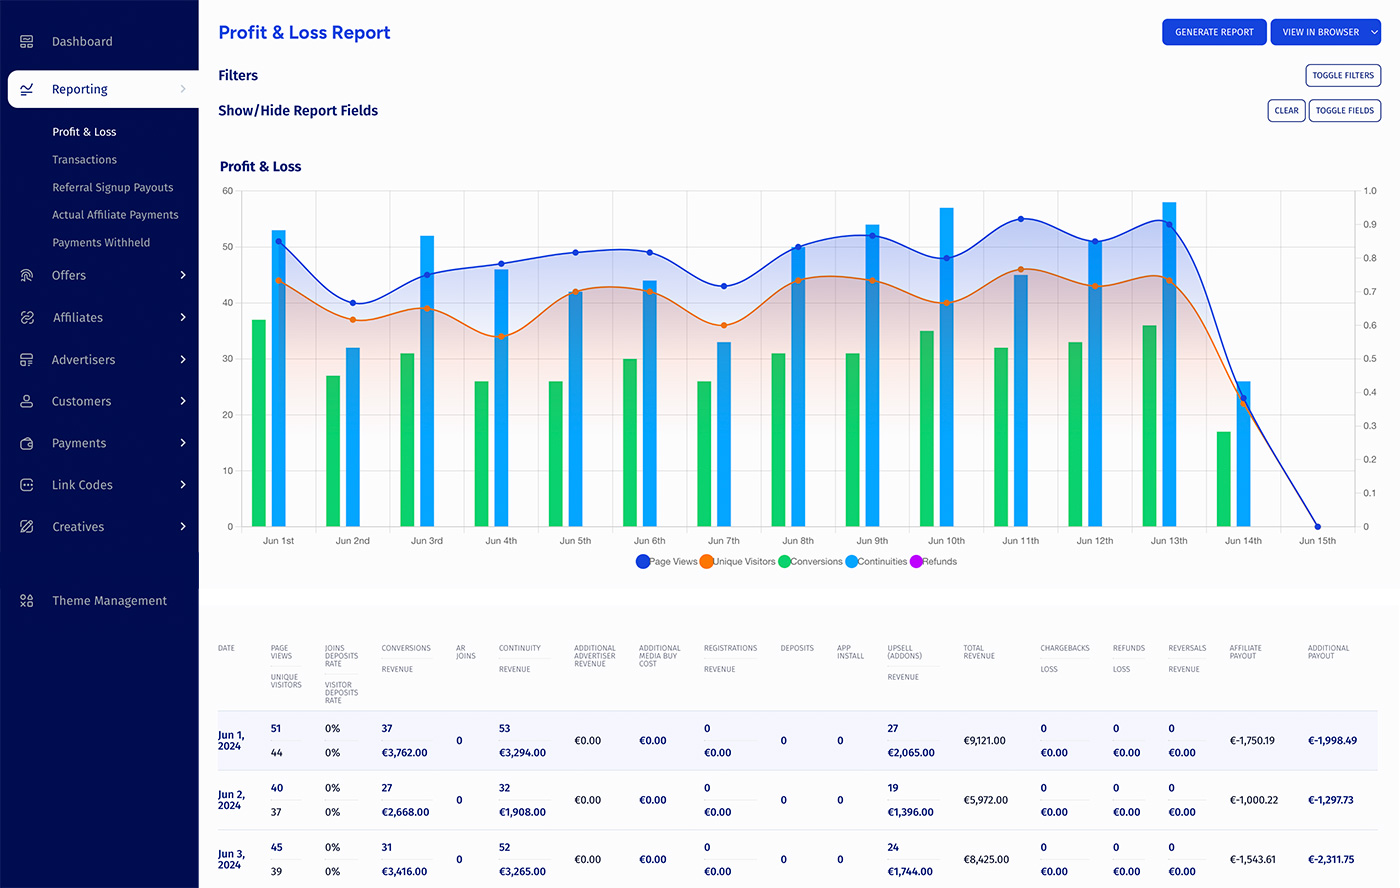
The Profit & Loss Report provides a visual graph using various statistics, as well as a comprehensive table breaking down these statistics in text form. This helps to maintain accurate records on your offer's total profit and loss, as well as being able to see all separate statistics that comprise this total profit and loss allowing you to see where any inaccuracies in your accounting may come from.
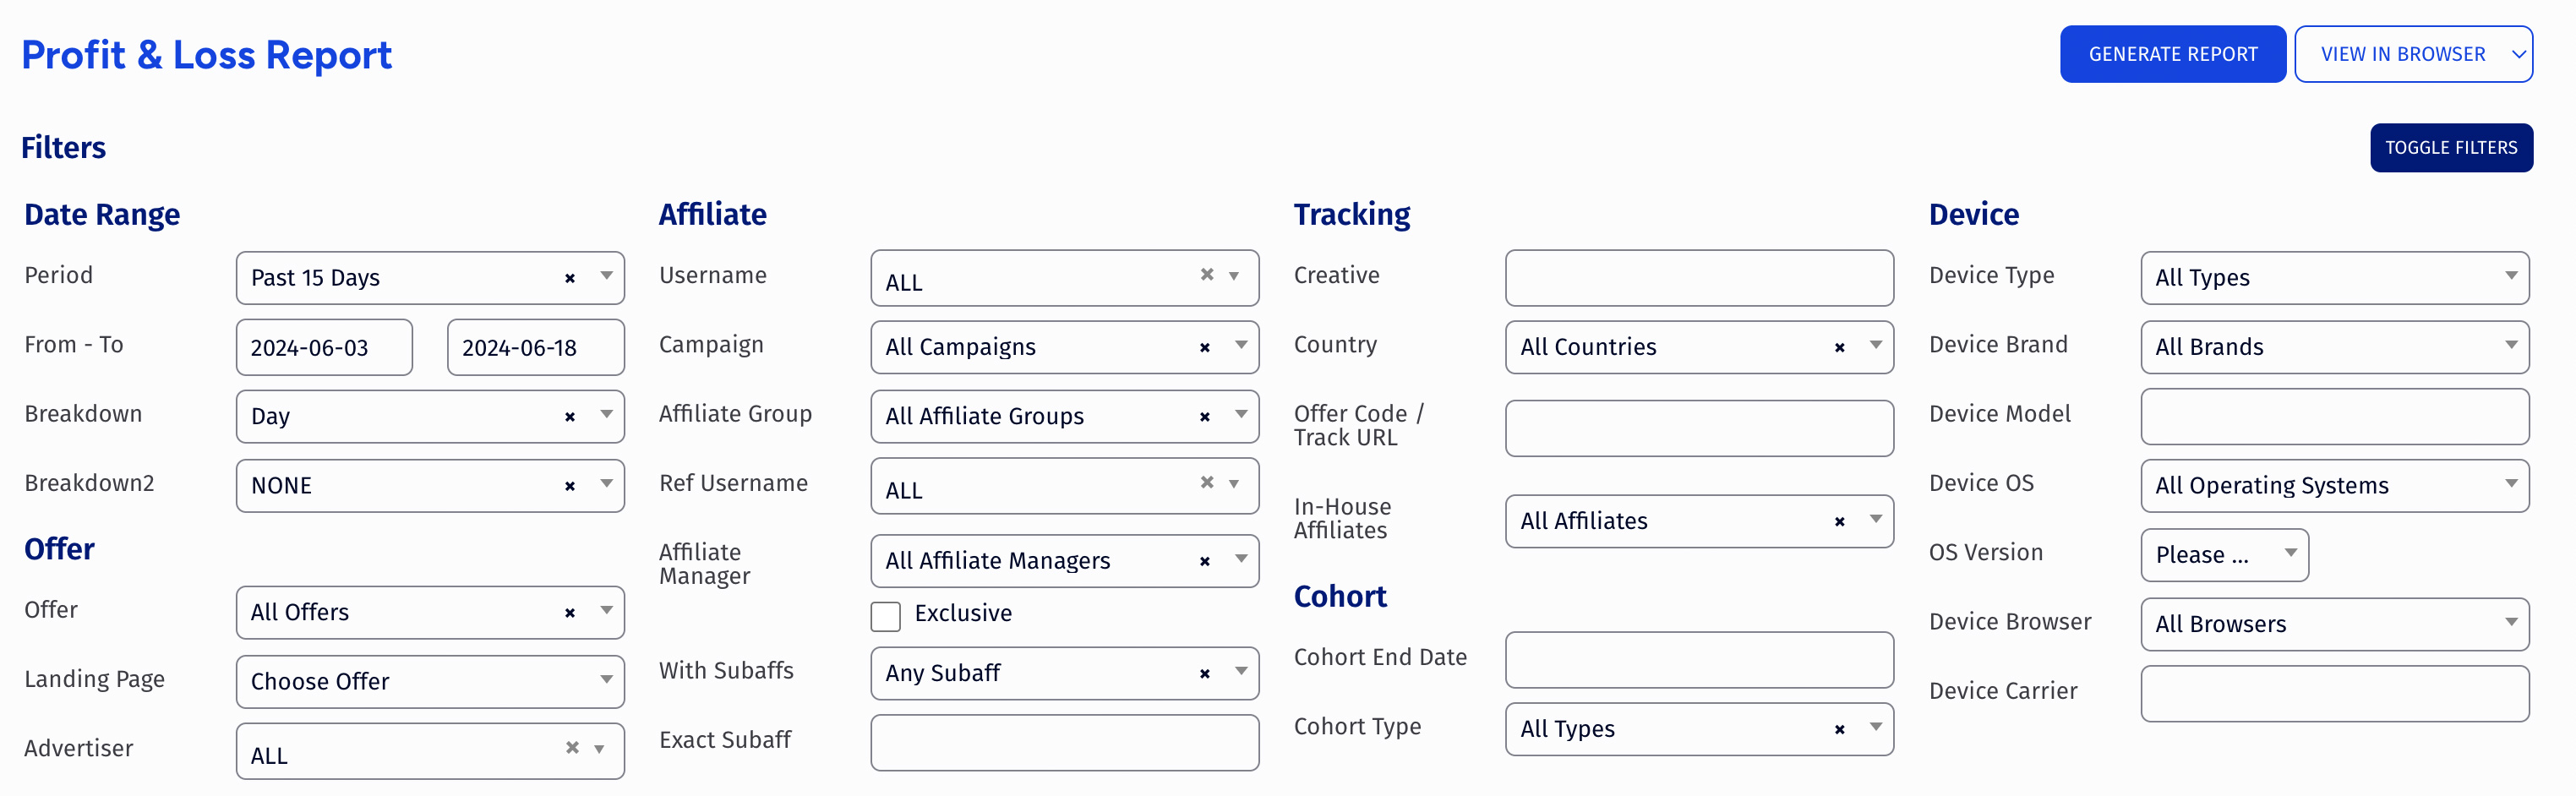
The section features an extended filter form, a graph chart, and a data table. Filters allow you to narrow down your results by using various parameters, including parameters from Date Range, Affiliate, Offer, Tracking, and other.
Data Chart
The Profit & Loss graph shows a day-by-day breakdown of relevant statistics for your offers, including:
- Sales - How many visitors have completed your offer.
- Continuity - How many customers have completed recurring transactions.
- Refunds - How many customers requested refunds.
- Reversals - How many times a payment reversal was charged that day.
- Page Views - How many overall Views your offer received.
- Unique Visitor - How many unique views your offer received.
Data table
The table at the bottom of the page displays all of the above statistics in a text form. This also includes a variety of other statistics, including exact dollar numbers of any income, loss, payouts, and fees accrued for each day.
Some figures in this report table will appear as hyperlinks. These figures can be moused over to view a brief breakdown of how these sums were calculated. Clicking on a statistic will take you to a detailed report about each statistic.
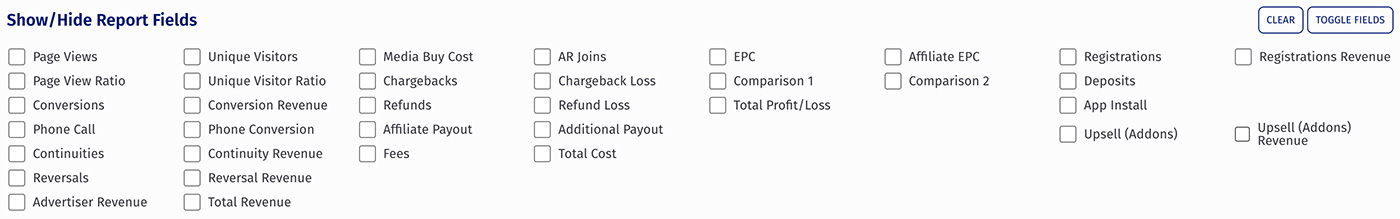
You can limit the columns in the rendered data table by selecting which fields you want to see in the Show/Hide Report Fields section right below the filters.
Downloading data
You are able to download the generated statistical data in different formats. Options include: - plain text - CSV - XML
To download your data set, select an option from the dropdown menu (set by default to "View in Browser") top right on the screen (next to "Generate Report") and click the "Generate Report" button.